Most of my large projects are using Entity Framework. And Entity Framework is known to sometimes create crazy sql requests. Or rather it easily allows developers to create crazy queries. It is really easy to throw couple .Include() into your query and then return objects as they come from EF:
var products = dbContext.Products.Include(p => p.Tags)
                                 .Include(p => p.Reviews)
                                 .ToList(); // first query
foreach(var prod in products)
{
    var reviewers = prod.Reviews.Select(r => r.Owner).ToList(); // N+1
}
The above code is fictional, but most likely will produce N+1 issue. N+1 issue is when you don’t just issue a SELECT query, but follow up every returned row by another SELECT query to retrieve related entries. This is caused by EF feature called Lazy Loading. Read better explanation about Lazy Loading problem here. Basically think that your first query for Products returns 1000 records. Then in case of N+1, operation inside of foreach loop will produce another thousand queries to your database.
This is a well known problem and there are a lot of resources talking about how to fix it. Once you know you have this problem, it is easy to fix. But knowing about it is another matter.
Usually development happens against a database with some test data. This database usually has a few records in each tables, not as much as you would normally have in your production. So when developer introduces N+1, on his local machine the query might execute fast enough not to notice a problem. And when this code is pushed into production, this eventually causes a performance problem.
Another performance problem I found when using EF is throwing away data requested from database. You might have Product entity with hundreds of properties. And then doing things like this:
var product = dbContext.Products.FirstOrDefault(p => p.ProductId == 42);
return product.Name
EF will generate a query that gets every field of Product object, serialise that into memory. But you only need a Name – you throw away all the rest of requested data. This might not sound like much, but if you have BLOB data stored on Product, and your Database Server is not on the same server-rack as you Web-server, network transfer and memory consumption can add up and cause trouble.
Again, once you know there is an issue, it is easy to fix. But how do you know there is an issue??
The easiest way is to look on the queries that are executed by your application. There are a few ways to do that – one of them is to run SQL Server Profiler. But this is a heavy-weight beast that does everything and a kitchen sink. And I can never remember how to configure it correctly so it shows only the stuff I want to see and not every sneeze and scratch that SQL Server does internally. Another recommended way is to use MiniProfiler. I used it, it is cool and easy. Until it craps all over you: have you tried looking on N+1 issue of any sizeable dataset/query? It crashes any browser with amount of DOM elements. It has it’s uses and very nifty, but after a few incidents when I had a real nasty N+1 and had to disable MiniProfiler just to be able to debug, we parted our ways. Now I prefer external profilers.
Express Profiler
I’ve spent some time trying to find a tool that would satisfy all my desires and seems like there is a winner: Express Profiler. It is free and easy to configure. I usually have it running in a background when I write any queries – just to check if page have filled with N+1 queries for related objects requests.
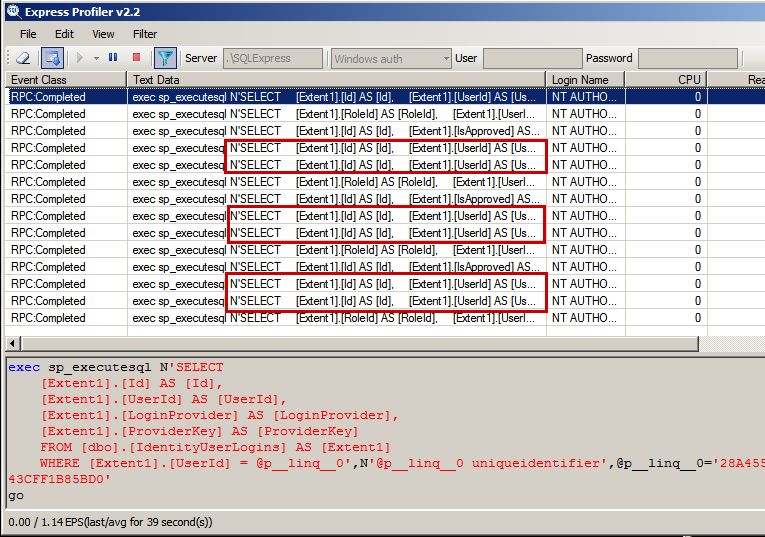
As a rule of a thumb if your application’s page refresh causes profiler’s screen to fill-up with requests you have an N+1 problem. If your Reads or CPU count is high, but you don’t really expect a high read query, you might have another problem: getting data, but then throwing it away. But this is less of a rule.
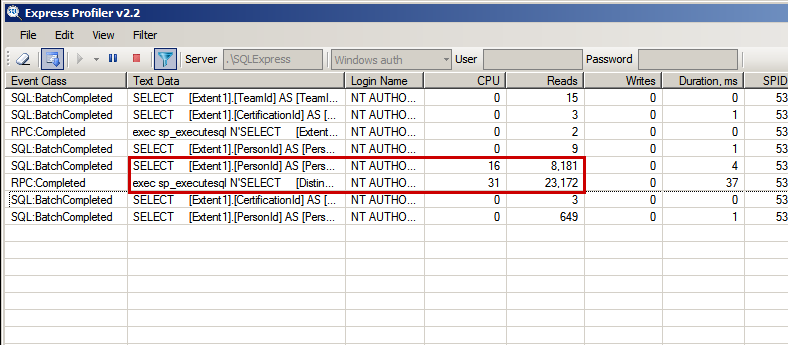
If your query is very long, does many joins and returns many fields. But you actually use only a handful of fields from that object:
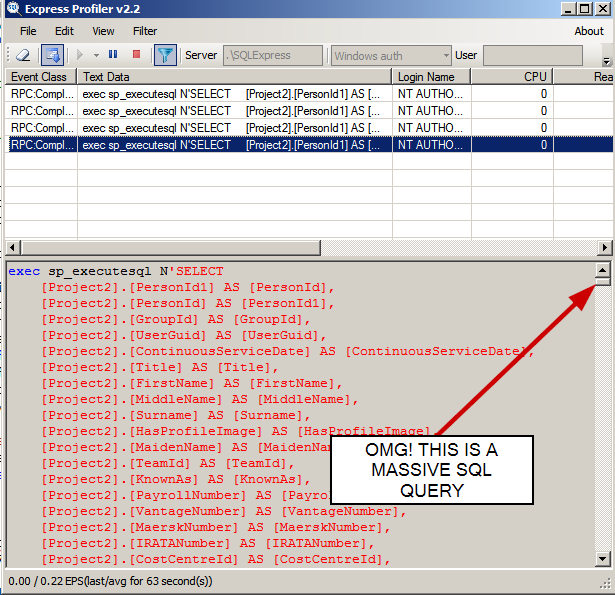
Then you definitely getting all this data then throwing it away data, wasting network bandwidth and memory.
Usage
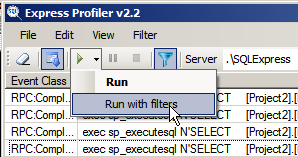
One thing that I always do when use Express Profiler is exclude connection reset events. You can do this by adding exclusion of %sp_reset_connection% to the default set of filters:
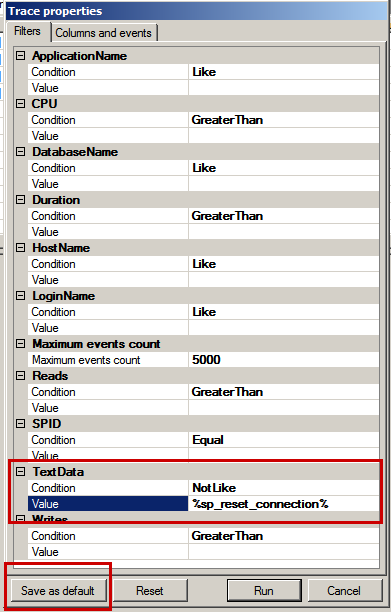
And then always run profiler with filters:
Conclusion
If you are using any type of ORM: EF or NHibernate or any other where you don’t write queries by hand, Express Profiler is a must have tool. And it must be running on your machine whenever you write DB-related code.
So go to https://expressprofiler.codeplex.com/ download, install and use it!
p.s. I’m not in any way related to the tool promoted here.